
HBF Customer Satisfaction Survey Results 2016
The waiting is over. The results are in, and the winner is……. well pretty much the whole house building industry if you believe the accompanying Home Builders Federation (HBF) editorial headlined “Homeowner satisfaction with new homes remains high.”
The HBF use the same phrases every year, irrespective of the survey results to market new homes. Why else would the HBF list on the front page their “key benefits of new homes” for the last four years, including the claim that “new homes are built to a higher standard than ever before and the customer satisfaction survey results reflect this” – well not over the last three years they don’t! Since 2013, the key satisfaction questions have provided results that show a marked decline from 91% in 2013 to 85% in 2016!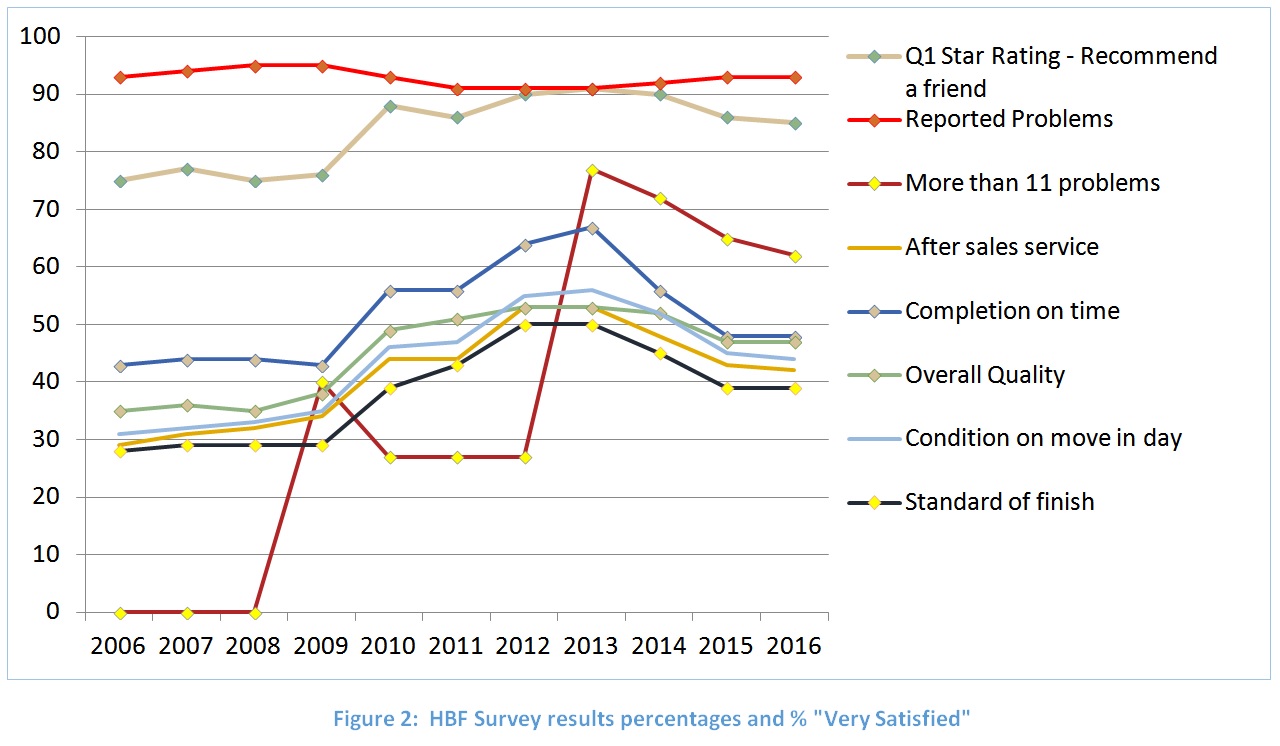
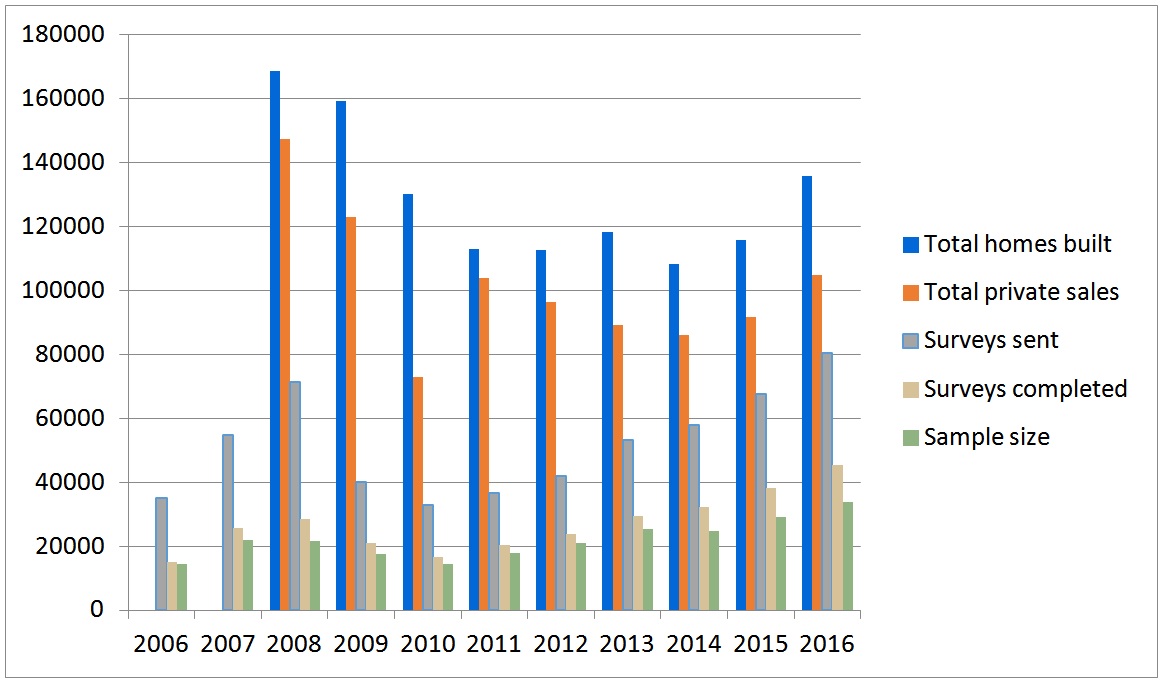
During the survey year to 30 September 2015, a total of 135,860 new homes were built, of which 104,670 were privately sold, these being potentially eligible to be part of the HBF customer satisfaction survey and only new homes with an NHBC warranty (around 80% of new homes) will almost definitely (96%) receive a survey, provided that these homes are not rented by buy-to-let private landlords. Out of an approximate potential 83,736 privately sold new homes (104,670 x 80%), the NHBC sent out 80,582 surveys on behalf of the HBF and received 45,342, a response rate of 56%, exactly the same as the previous year.
The HBF claims:
“Housebuilders are delivering extremely high levels of customer satisfaction.”
Some claim! Especially considering that the 2016 results again show 93% of new homebuyers reported problems to their builder in the first 8-15 weeks. Indeed, since the survey began in 2006, between 91% and 95% of homebuyers reported problems with this industry’s product! The number of buyers that reported more than 16 problems has been in the range 34% and 47% since 2013. In fact, I would suggest that a new category of more than 50 problems would probably yield a similar percentage! A psychologist could also argue that a new homebuyer reporting 20 problems to their builder, all of which are then sorted out in an efficient and timely manner, is more likely to give a higher satisfaction response in the survey, than a new homebuyer who never reported a problem.
“The results of the 11th survey demonstrate a customer satisfaction level that matches or exceeds those in almost any other industry or sector”
It could be that new homebuyers moving from cramped, rented accommodation in need of upgrading, to a brand new home are always going to be inclined to be at least fairly satisfied. The same could be said of someone buying a new Ford Focus after driving around in a rusty 1990s Ford Escort. The only difference being that 93% of Ford Focus buyers do not have to take their new car back to the dealership to get defects repaired within the first 8 weeks. Furthermore, the car is delivered on the date promised without mechanics rushing to fit wheels and finishing it off when they get the keys! Even the most recent National Rail Passenger Survey showed that overall, 83% of passengers were satisfied with their journey and overall satisfaction of train operating companies was between 73% and 97%! (August 2015)
“86% of respondents were satisfied with the overall quality of their new home”
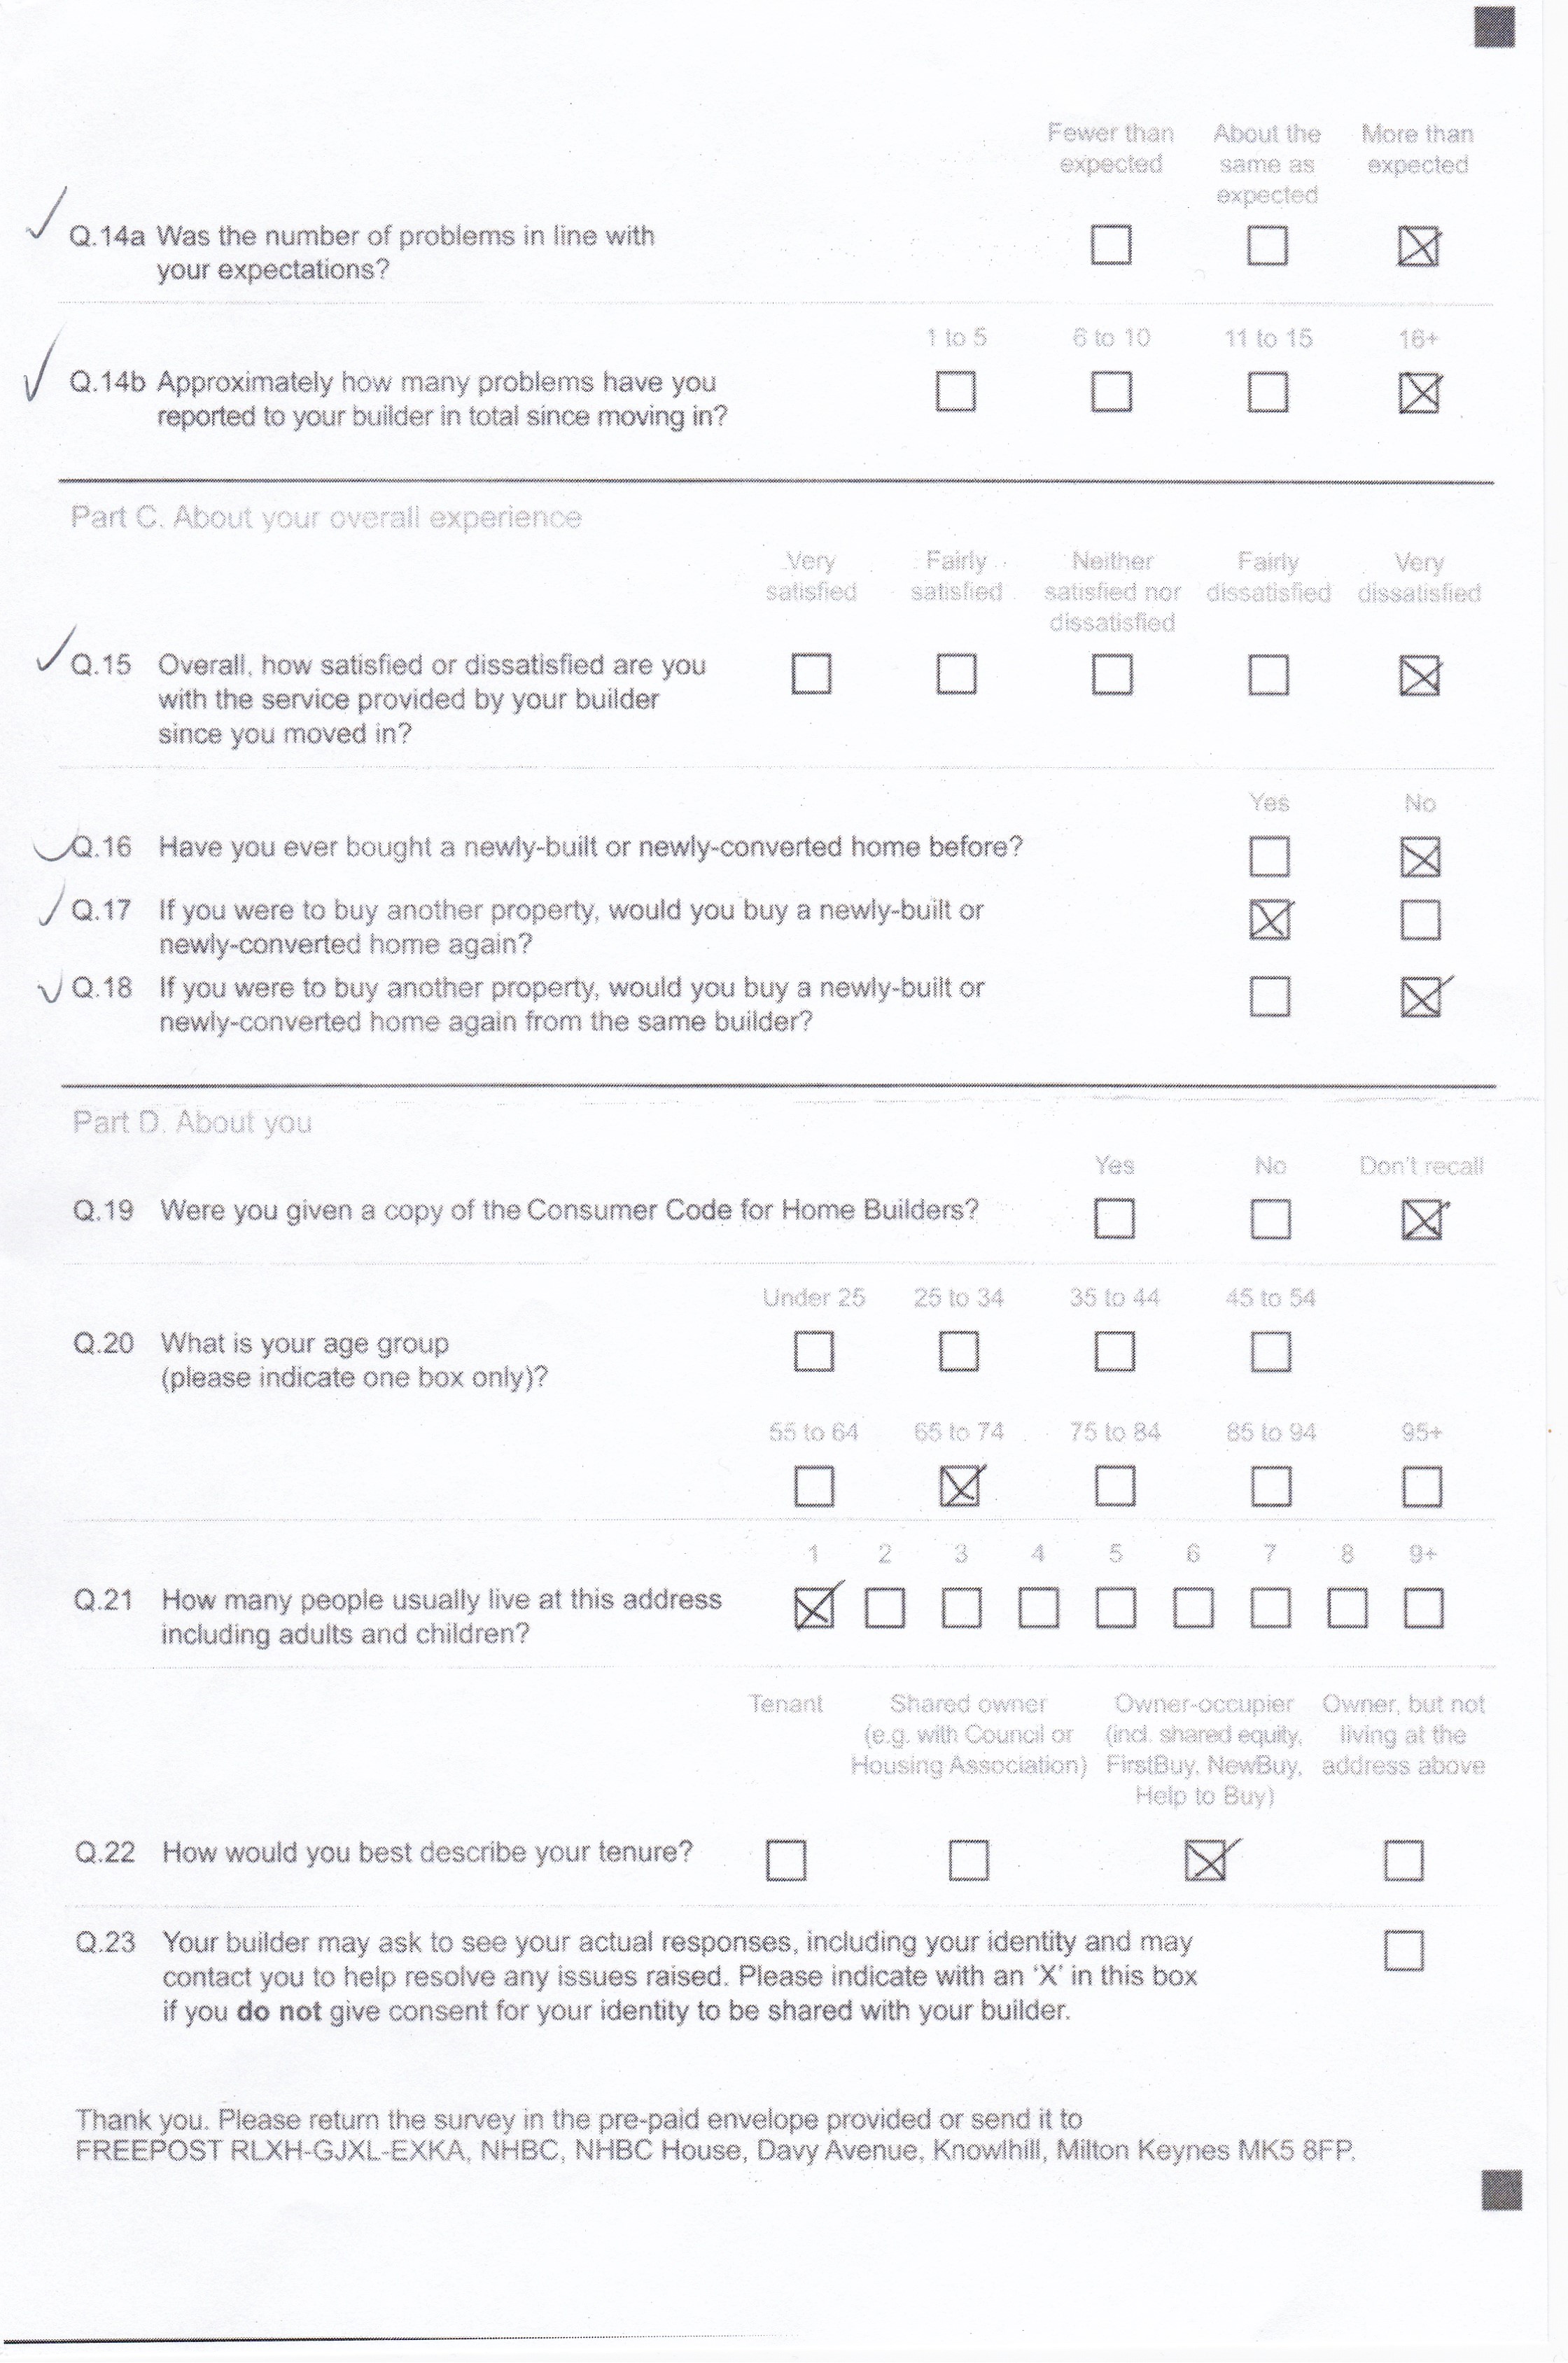
Not quite! 39% were only “fairly satisfied” Given that the industry promotes an expectation of failure, delivering a defective and imperfect product; respondents are probably ‘fairly satisfied’ that their new homes are not worse than they expected, with 43% confirming the number of problems they encountered was in line with their expectations.
“levels of customer satisfaction are one of the many reasons why more and more people are buying new”
It could be more realistically argued that the taxpayer-subsidised Help to Buy Scheme, accounting for around 37% of Taylor Wimpey sales and 42% of Persimmon sales in 2015 is the main reason for increased demand for new homes.
“New homes are built to a higher standard than ever before. And the customer satisfaction survey results reflect this”
Just not true! Looking at the survey results over recent years. The highest ever “satisfaction” was in 2011/12 (91%). Since then there has been a steady decline to the present 85% level. In fact customer satisfaction level is lower than it was in 2008/09 when more new homes were being built than last year! As for higher standards, 62% of respondents confirmed they reported more than 11 problems with their new home (27% in 2012).
“Since the survey was first introduced 12 years ago, the industry has consistently demonstrated a commitment to customer service……….There is of course always room for improvement. As we look to maintain the increases in output we have seen, we must all remained totally focussed on ensuring customer service improves still further.”
Sadly, such demonstration of “commitment to customer service” has been sadly lacking over many years as the recent three-year decline in satisfaction levels from the survey indicate. As the Bovis e-mail (below), featured in the C4 Dispatches programme last November demonstrates, this is the industry’s real attitude towards “customer service.”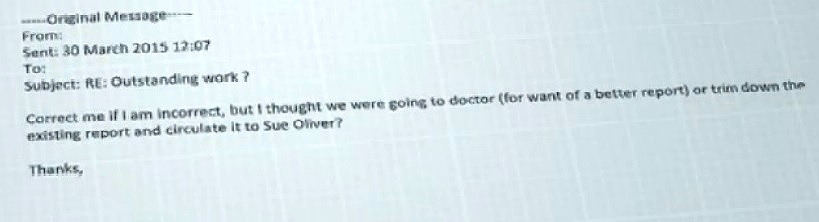
With the exception of Barratt, all of the major house builders have a lower star rating losing one or more stars, or remained at the current industry low rating of around 85%. This has nothing to do with increased production or any perceived skills shortage. The only significant increase in the number of new homes built since 2011 was in the last survey year (2014/15 up 17%) and the CITB has been collecting a levy from construction employers and using this to “support training and skills in construction” since July 1964.
How do we know the builder Star Rating is an accurate reflection homebuyers’ responses?
Rule 11 of the HBF star rating scheme states: “Members may not use or refer to the statistical data underlying their Star Rating in the public domain.” So why the need for secrecy?
Not every returned survey is used for Star Rating. This year 11,499 (25.3%) of surveys were not used. (Last year the figure was 8.974 -23.5%). The HBF told me that the total 45,342 survey responses included those who bought homes from non-HBF members. As the Star Rating is just for HBF members, the surveys from buyers of non-HBF member homes are not included in the star rating, explaining the lower reduced sample. The HBF said: “every single valid Barratt response (7,594) counts towards Barratt’s rating; every single valid Bovis response counts towards their score and statistically, based on 1200 of their customer’s responses, they are a 3 star builder. Not one valid response is ‘not used’ for any company.” (A ‘valid response’ is one which is returned by the homeowner within the 20-weeks of moving in.) Of the 33,843 surveys ‘sampled’ for the 2016 star rating, 33% of the sample were five star ratings, 41% four star, 21.5% three star and 1.3% two star.
However, looking at the 2012 survey results, (the last year that the sample sizes were stated for all questions and before the use of pie-chart graphics), it can be seen that the sample for the ‘Industry Results’ (which includes responses of buyers from non-HBF member builders), the sample size is the same as the total sample for the Star Ratings – 20,129.
In the Star Rating results until 2011, an error identifier was used to indicate that the true figure could lie in a higher or lower star band. It stated:
“The star ratings are based on sample estimates, and are therefore subject to sampling error. For each estimate, there is a 95% chance the true figure lies within an error range either side of the sample estimate. For example, a company may have 72% responding Yes to Q8, with an error range of +/-3%. The result would be shown as three stars. However there is a 95% chance the true figure lies within the range 69% to 75%. An ‘α’ indicates that, taking account of the error margin, the true figure could lie within a lower star band. Alternatively, ‘β ’ indicates the true figure could lie within a higher star band.”
Quite why, in this age of computers, any sampling is required I don’t know, especially as it would appear to create an unnecessary and fully-preventable error in something the industry relies on year after year to paint a rosy picture, giving the illusion of new homebuyer satisfaction. The HBF spokesman told me “there’s nothing to hide here – we just simplified the document as it was very long and repetitive. The full details are all on the web site.” Surely adding the “Key benefits of new homes” and marketing quotations from 5-star rated house builders and a few carefully selected new homebuyers made it even longer! In addition, at the time of writing I have not been able to find the “full details” of the error identifiers (for any survey since 2010) on the HBF website either!
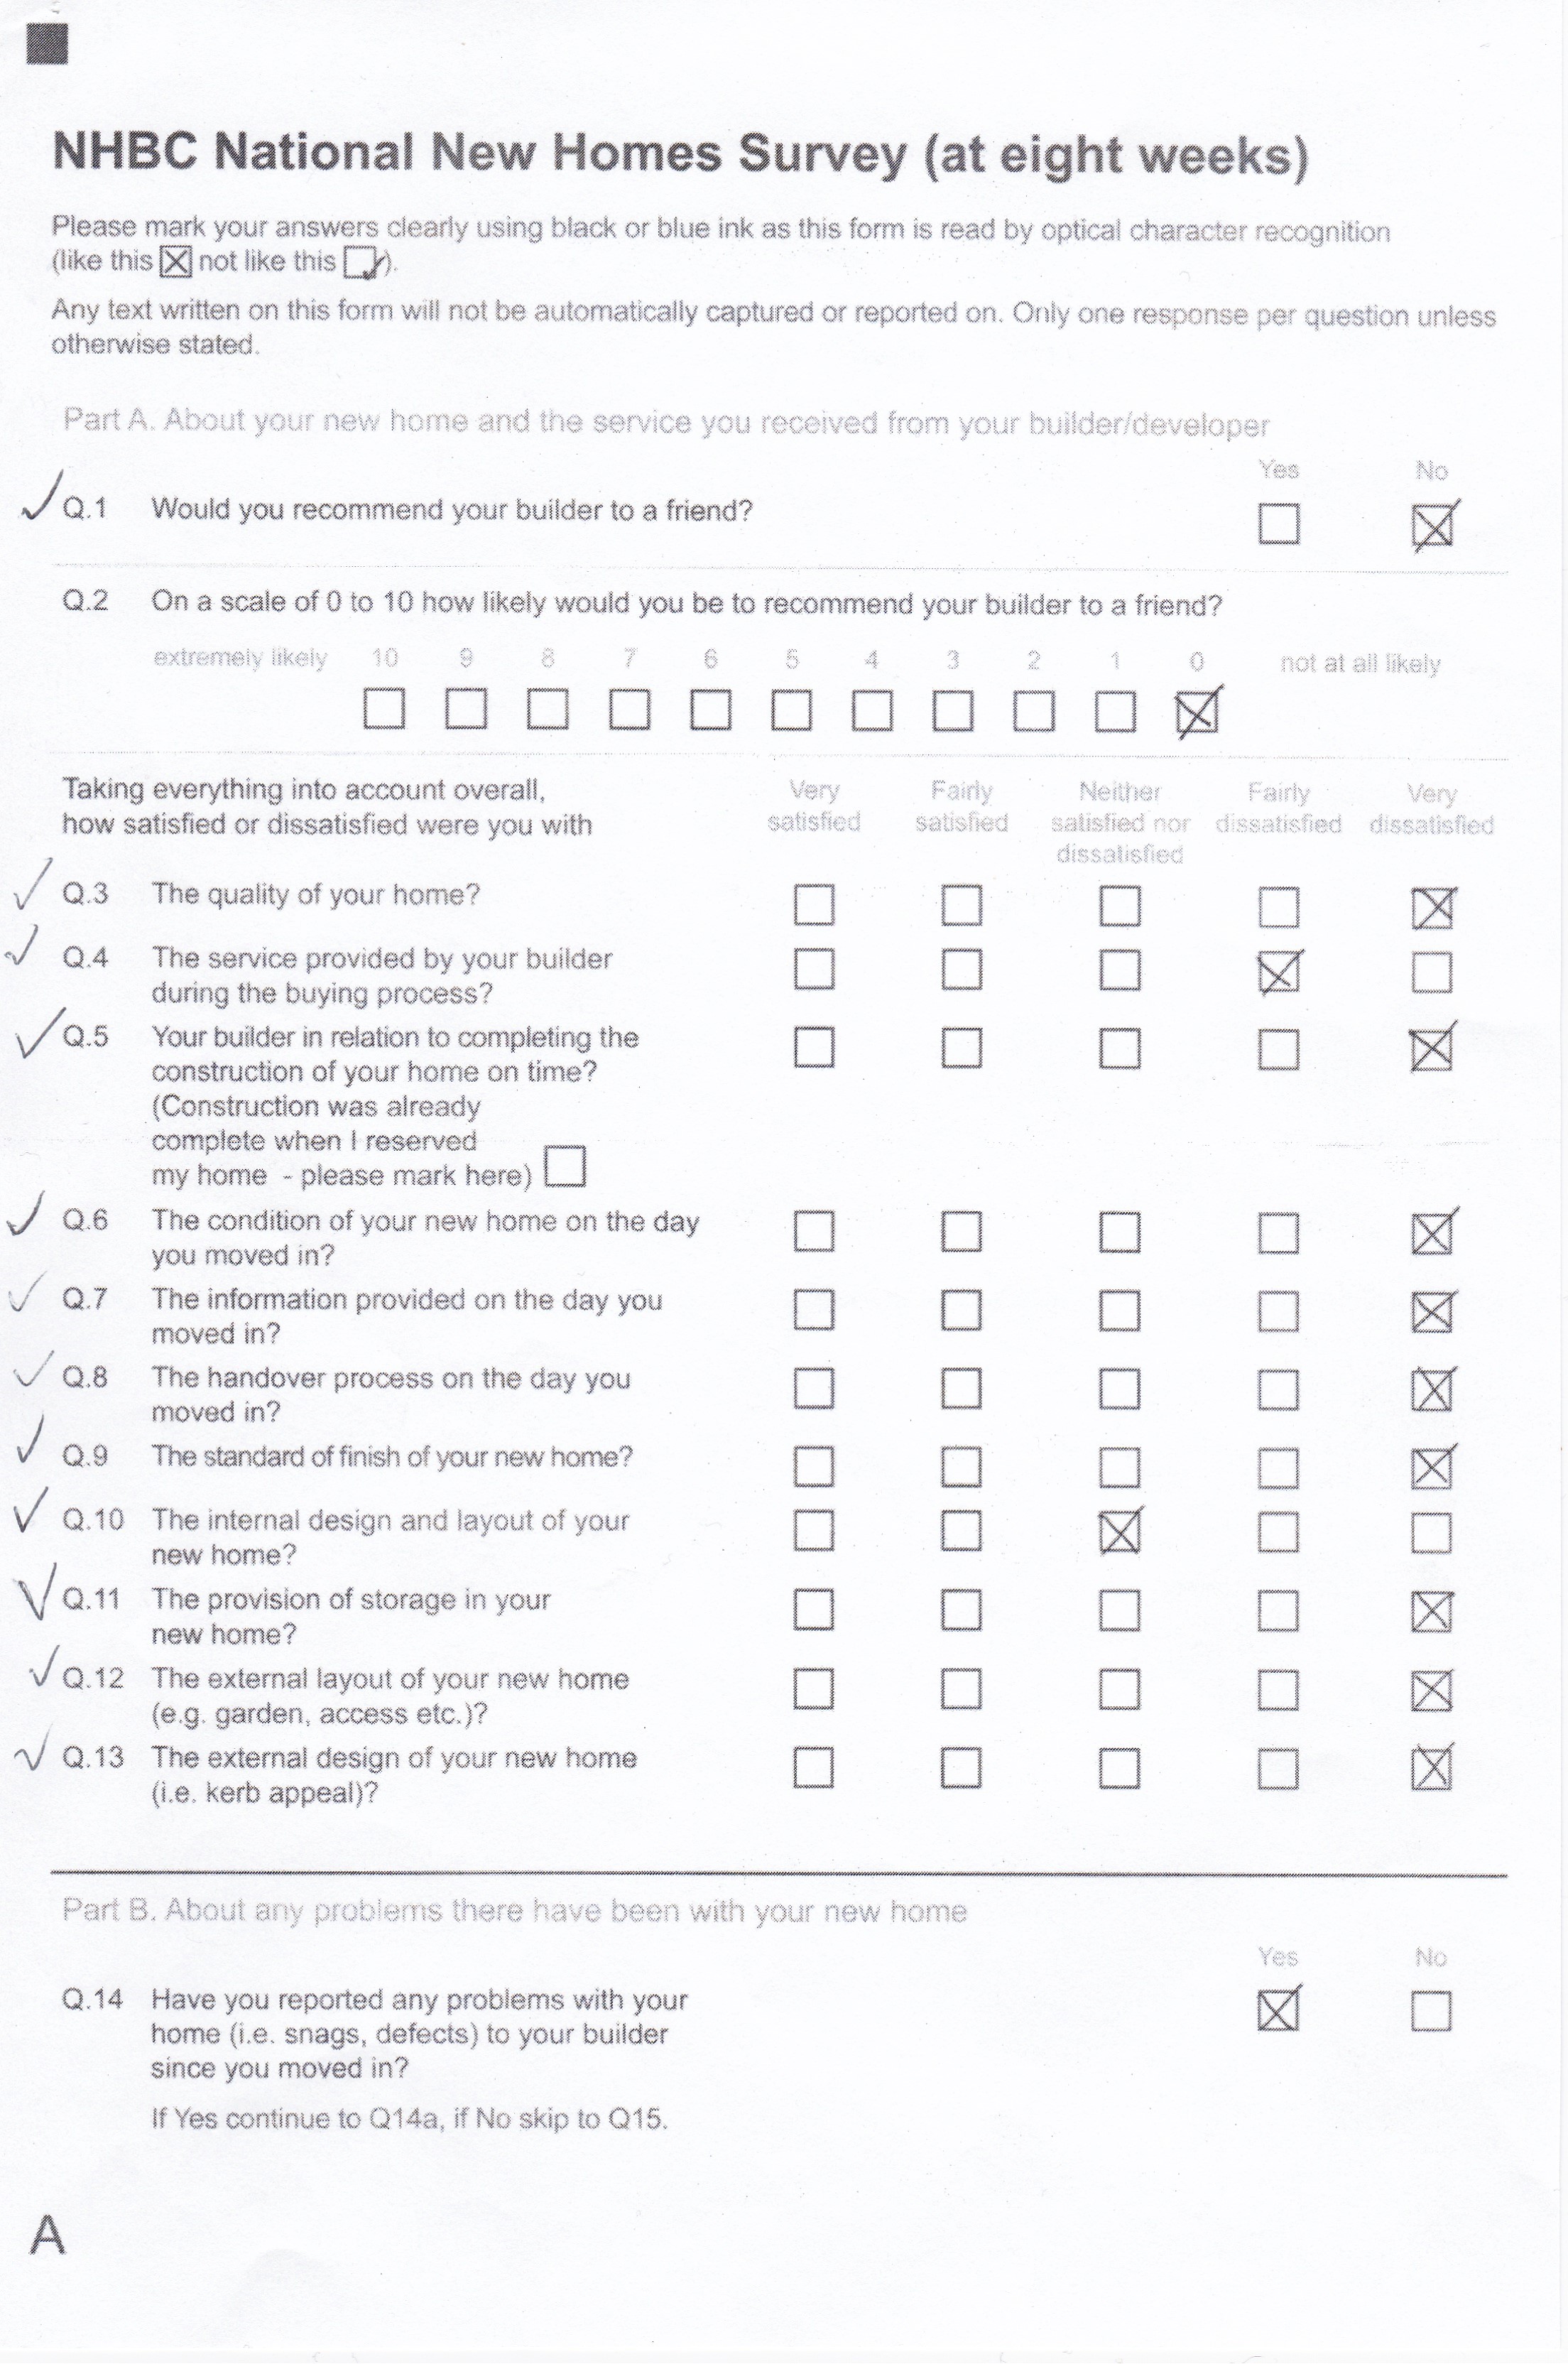
Despite being the second question for at least the last two surveys, this was the first year the survey results included responses to the question “On a scale of 0-10, how likely would you be to recommend your builder to a friend?” The results show that just 47% would be “likely,” 30% “neutral” and 23% “not likely”. It can be argued that this is a far more accurate reflection than the Yes/No version of the same question. In fact if you deduct the neutral 30% from the overall 85% “Yes” score, it would imply the real figure is around 55% – giving the industry an overall satisfaction rating of 1 star!
The proportion of homebuyers completing the survey has remained suspiciously consistent at around 56% over last 6 years. Some housebuilders appear more successful than others, with 46% of Barratt homebuyers returning the survey compared to just 37% of Taylor Wimpey buyers and 30% of Bovis buyers.
The way the HBF presents the results has changed. Since 2013 a colour graphic has been used with almost indistinguishable colours for both “very” and “fairly satisfied” which can only be to give a misleading perception of higher overall levels of satisfaction. In 2014, the words “Taking everything into account…..” were added before questions 3 to 14. This term would lend itself to a more positive response than a straight “How satisfied….” question.
The survey is out of date by the time the results are published.
The survey year ends on 30 September but the actual results are not published by the HBF until “mid-March.” This means that a house builder displaying a ‘5 star 2015’ flag in 2016 could be rated 4-star for 2015, as the results are not known until March 2016. For all responses, the survey results are nearly six months old by the time they are published.
The HBF said that “Homeowners are first invited to complete the survey 8 weeks after their legal completion date; they then have a further 12 weeks to respond. So homeowners who legally completed on 30th September (last day of the survey year) are invited during November and have a further 12 weeks to respond to the survey which brings us to mid-February. So in effect the ‘survey year’ is up to 20 weeks behind the ‘reservation year’ being measured. We then have to get the results validated by Reading University and then sort out the document that we publish – which takes us to mid-March.”
In the letter sent by the NHBC with the survey, it asks buyers to complete and return it to them within 7 weeks of the date on their letter. When I contacted the Statistical Services Centre at Reading University to ask how “validation” is carried and what is involved they said; “I can confirm that the Statistical Services Centre validates the results published by the NHBC from the said survey, using a methodology set out by the NHBC themselves. We have never advised on which question to ask or how questions are presented. All further queries should be directed to the NHBC” As all completed surveys are returned to the NHBC, presumably Reading University only “validate” the survey responses they are given by the NHBC.
It should also be noted that the NHBC provide a service for house builders so they can view their daily updated results in real time online – enabling house builders to track “how satisfied their customer are.” – or not as the case might be! But UK new homebuyers have to wait for out-of-date information to be published!
I am currently researching and writing an article which shows just what some of the large house builders will do in their attempts to improve their Star Rating and survey scores. Watch this space!


